Acquisition project | 75F
Brand & Company: 75F
Product: IoT Building Management System
Have you ever come across this image?
No, It is not a Netflix intro animation effect. It is far more serious and dangerous for this planet.
It is a color scale representation of the change in global temperatures covering 1.35°C from 1870 to 2017 and it keeps rising.
One
Yes,
Global warming is real!
It is majorly caused by human actions!!
And one of the main culprits is Commercial Buildings!!!
Commercial Buildings are the 3rd largest emitter of greenhouse gases accounting for 38% of Global greenhouse emissions.
Out of that, 30% of the energy consumed in commercial buildings is wasted due to inefficiencies and improper operational practices.
The world needs an efficient, Intelligent, and scalable way to manage commercial building operations.
This is when the Building Management System comes into the picture.
A building management system (BMS) is a control system that can be used to monitor and manage a Commercial building’s essential services such as
- Heating Ventilation Air Conditioning (HVAC)
- Fire & Safety
- Video Surveillance and Access Control
- Water pumps, DG sets
However, the picture we discuss is not yet so clear and smarter.
This is what the typical Building management system looks like: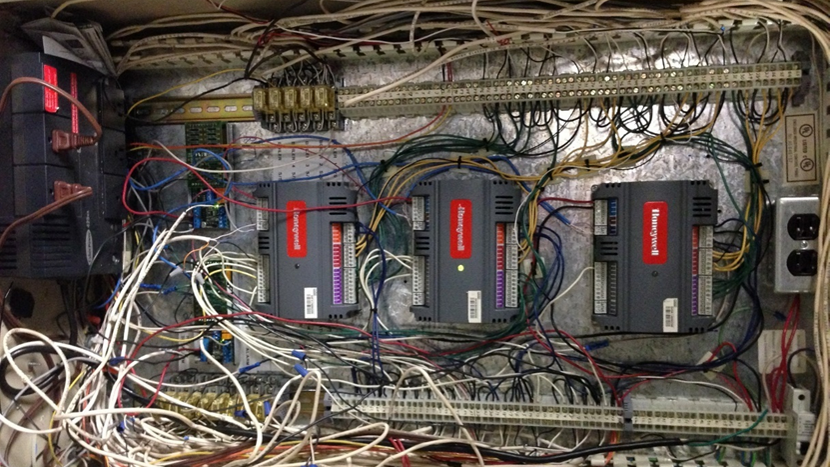
It is messy, wired, and complicated in every sense.
- It is not cloud-based so the learnings and updates are not shared and controlled remotely.
- Hardware follows closed protocols which is Inefficient in data management.
- It doesn’t not assure energy savings not provide Indoor air quality management.
Does this sound familiar?
Well, Hot spots and cold Spots are the most common issues a typical office building occupant experiences. Traditional BMS can’t solve it as it is not designed for these issues.
Now let me introduce you to 75F IoT BMS:

So what is 75F -
75F is a fast-growing Building Intelligence Solutions provider that leverages the Internet of Things (IoT) and cloud computing to predict, monitor, and proactively manage various elements in a building including its temperature, lighting, air quality, and it's energy management needs.
It is a BMS that provides hardware + software applications to commercial building spaces to help them monitor their energy consumption and improve indoor air quality and building operations.
What is so special about 75F?
75F BMS predicts a building’s energy needs and manages them proactively, making buildings more energy-efficient, automated, smart, and comfortable,
75F IoT Vertically integrated BMS :
You can read more about the Product on 75F Website: https://www.75f.io/en-in/
Operational Geographies: US & APAC (for this acquisition project I have selected India operations only, as GTM differs in every target market)
Ideal customer profile in Indian Context
| ICP 1 | ICP 2 | ICP 3 |
ICP Name | Mahesh Reddy | Gulshan Sharma | Nishant Nishoo |
Job Title | Facility Manager | Head of Real Estate | Director of Engineering |
Industry/Type of company | ITeS & MNCs, Office Buildings | Retail (Fashion, Appliances) | Hospitality |
Locations | Tier 1 cities - Mumbai, Bangalore, Delhi NCR, Hyderabad, Pune, Chennai | Tier 1 & 2 cities - Mumbai, Bangalore, Delhi NCR, Hyderabad, Pune, Chennai, Ahmedabad, Kolkata, Kochi. | Tier 1 & 2 cities - Mumbai, Bangalore, Delhi NCR, Hyderabad, Pune, Chennai, Ahmedabad, Kolkata, Kochi, Vadodara (Except Bihar, Jharkhand and UP) |
Age | 35-45 | 40-55 | 40-55 |
Gender | Male (95%) | Male | Male |
Company size | 500+ Employees, Multiple offices PAN India, 50 Cr+ Annual Revenue | 300+ Employees, Multiple Outlets PAN India, 70 Cr+ Annual Revenue, store size > 10,000 sqft. | 200+ Employees, PAN India presence, 30 Cr+ Annual Revenue, Area > 50,000 sqft. |
Company Growth | BMS is a need, an operational perspective it is a must | Established or Growing stores, should have a Sustainability department to take care of Efficiency | BMS is good to have but not a must as It adds CAPEX/OPEX cost. If it is a part of a global or national chain with a central Engg team then It’s good to go. |
Building Types | Owned or long lease office Building, 30,000+ Sqft of area | Owned or long lease Building, 10,000+ Sqft of area. | Owned or long lease Hotel/Resort Building, 50,000+ Sqft of area. |
Budget | 80 -100 Rs/sqft; Mostly CAPEX | 30-40 Rs/sqft; 6-8% YoY cost; Mostly OPEX | 60 - 70 Rs/sqft; Mostly OPEX |
Buying Process | Site feasibility survey > Pilot study > Final implementation | Site feasibility survey > Pilot study > Phase-wise implementation | Site feasibility survey > Pilot study > Final Implementation |
Purchasing decision makers/Buying committee | Facility manager, facility director, CFO, CPO, COO | Head of Real Estate, MEP Head, CFO, CPO, COO, CEO | Engineering Head, CPO, COO |
Applications/Tech stack | CAFM Applications, Resource management tools (RMS), Green Building / Sustainability planner - Reporting tools - WELL, LEED reporting | Resource management tools (RMS) | Resource management tools (RMS) , Energy management systems (EMS), |
Pain Points | High electricity bills, Manual operations of HVAC in the building, non-visibility of energy consumption across floors/assets, poor Indoor Air Quality, Lack of energy benchmarking across a portfolio of buildings | High energy consumption even in low occupancy hours, Inability to monitor multiple stores on a single dashboard, Limited automation even with BMS deployed, HVAC & Lighting Control | High Energy cost as Up to 57% of energy is spent on HVAC & Lighting alone across the building. Occupant discomfort represents 42% of all hotel complaints. Inconsistent temperatures across different parts. |
Use cases | Chiller plant management & Chilled water management at HVAC equipment, Airflow balancing to reduce hot zone & cold zone complaints, Remote monitoring, and Indoor Air quality monitoring. | Energy monitoring & portfolio level Dashboard, Automation & Control | Chiller plant manager & Chilled water management, Occupancy-based Integrated solution of HVAC, Lighting control, and Access management. Indoor Air Quality Monitoring |
Business Goals | Achieve Low Energy Performance Index for a building, Cut down on operational expenditure, Attain Green building certificates, Align with organizational Net Zero Targets | Deliver exceptional shopping experience to the shoppers, Cut down on excess energy cost, Align with organizational Net Zero Targets | Elevate Guest Experience through Seamless digital integration of all the touchpoints. Excel in Resource management benchmarks. |
Typical ROI | 18-24 months | OPEX for 4-5 years. | OPEX for 4-5 years. |
Max Value Utilization if the needs are - | Energy saving, Automation & Monitoring, Indoor Air Quality, | Energy saving, Automation & Monitoring | Energy saving, Automation & Monitoring |
BMS solution is applicable where you have a centralized HVAC system available. In India, most commercial buildings of mid to large size do have an HVAC system and hence there could be multiple ICPs that we can come up with (based on various market segments)
However, it makes sense to shortlist the 1-2 ICPs who would give you more business/effort ratio. for that reason here is the ICP Decision framework:
| ICP 1 | ICP 2 | ICP 3 |
Adoption Curve | Innovators - Early Adopters | Early Adopter - Early Majority | Early Adopter - Early Majority |
Frequency of usage | High, Daily Monitoring | Medium, Daily Monitoring | Medium, Daily Monitoring |
Appetite to pay | Highest | High | Medium |
Total Addressable market | $760,771,084 | $37,530,120 | $29,983,952 |
Distribution Potential | High | Medium | Medium |
As you can notice we need to look into the TAM of the product as well as the TAM for each shortlisted ICP to identify and narrow down our selection process.
Total Addressable Market (TAM)
There are 3- 4 ways to find out the TAM for a product. Being in the established yet fast-changing building automation industry we can implement Top Down and Market research approaches:
Market research:
According to the Building Automation & Control System Market report by Transparency Market Research, the total addressable market for IoT BMS in India in 2024 is close to $ 1.45 billion Considering Sensors, thermostats, software, and services.
Now that is a TAM for BMS across all the cities, industry verticals and building types.
There is another Top Down approach to find out the TAM for BMS solutions:
Top-Down approach:
Steps we need to follow for TAM:
- Total number of Commercial Buildings in India (market size)
- Total number of buildings that are suitable for BMS. Need to consider building size, HVAC setups and requirements.
3. Average revenue realization from buildings.
Buildings -
According to ‘The National Building Code of India’ there are 1,500,000 commercial buildings exist in India. This covers shopping malls, warehouses, industrial, Offices, Hotels, Hospitals, Multi-use commercial buildings and others.
Suitable Buildings -
Out of this, we need to assume a share of buildings that are suitable for BMS considering the size (more than 15,000 sq. ft) and HVAC setup (centralized HVAC only) as a prerequisite.
That number comes close to 25%.
Revenue per building -
Those 25% of the buildings constitute a mix all building types that are larger than 15,000 sq. ft of area. For this type of segmentation, the average cost of BMS per building can be between USD 8,000 - USD 9,000.
To summarize it,
TAM = (Total no of buildings * suitable buildings for BMS * Average revenue per building)
TAM = (1,500,000* 0.25 *8500)
TAM = USD 3,187,500,000
Serviceable Attainable Market (SAM)
For SAM we need to consider the building types which 75F is targeting and share of those types of buildings.
Target building types: Office, malls, hotels & Hospitals
SAM = (TAM * Penetration of building types which 75F is targeting)
SAM = (3,187,500,000 * 0.6)
SAM = USD 1,912,500,000
Serviceable Obtainable Market (SAM)
For SOM we need to consider key things about 75F market penetrations
75F is a new company (6 years in India) if we compare IT with industry giants such as Schneider, siemens, Honeywell and Johnson & Controls. (40+ years operational in India with 70% market share)
Out of HVAC, fire safety, lighting, surveillance & access control and MEP aspects of the buildings 75F Focus only on HVAC and Lighting.
75F has a smaller sales and marketing team and is operational in Tier 1 cities only.
Considering all these aspects 75F can capture 4 % of the market share.
SOM = (SAM * 0.04)
SOM = USD 76,500,000
75F Top competitors in India:
| Schneider Electric | Honeywell | Johnson & Controls | Siemens |
Products | Hardware, Sensors and cloud platform + Energy management + Security + Access Control | HVAC Controls + Building Automation and Energy Management. | HVAC + Lighting + Security + BMS/BAS/BCS Systems | Energy Management + Lighting Solutions |
BMS Type | Cloud + On-premise BMS | Wired BMS system | Wired BMS system | Cloud + On premise BMS |
Global presence | Yes | Yes | Yes | Yes |
Market share | 18% - 20% | 22% - 25% | 14% - 16% | 16% - 18% |
TAM for the 3 selected ICPs
Another method to derive the TAM can be a function of the area covered by commercial buildings and the average cost per sq. ft. (The cost of BMS is calculated based on the cooling area of the building)
TAM for BMS = Area of total number of commercial buildings (avg size 10,000+) X Avg. cost of BMS per sq. ft.
This could be a cumbersome process for the entire market, however, if we do it for ICPs then it is relatively easier and accurate.
So for ICP 1 (Commercial office space)
TAM = (Total buildup area of Grade A office spaces in top 6 cities in India) x (avg. cost of BMS per sqft.**)
TAM = 701,600,000*90
TAM for ICP 1 = USD 760,771,084
** INR 90 is an average market price of BMS for a commercial office space
Source: * CRE Market Research Report-216: Analytics, Real Estate Price Trends (crematrix.com)
Similarly, we can find TAM for ICP 2 and ICP 3
TAM for ICP 2:
TAM = (Total Retail space stock) x (avg. cost of BMS per sqft.***)
TAM = 89,000,000*35
TAM for ICP 2 = USD 37,530,120
** *INR 35 is the average market price of BMS for a Retail mall
Source: India Retail: Evolving to a new dawn (jll.co.in)
TAM for ICP 3:
(Total number of rooms in a luxury hotel) x (Avg. area per room) x (avg. cost of BMS per sqft^.)
TAM = 95718*400*65
TAM for ICP 3 = USD 29,983,952
^INR 65 is the average market price of BMS for a Retail mall
Source: Number of rooms in Luxury hotels: India, 2020 - 2027 - GlobalData
Acquisition channels
IoT BMS is a purely sales-driven (push) product as it also involves solutions and commissioning which differ for every project. The marketing team can create awareness, generate demand, and nurture leads/feed relevant content throughout the customer journey (Drip campaign) for those reasons we have to resort to traditional marketing channels such as Telemarketing, paid ads, B2B close-door events, etc.
However, for this acquisition project, I have also experimented with other channels to find new lead sources and identify gaps in existing channels.
Channel Decision Framework:
Let’s under a few metrics about a product, the right communication channel, and average deal value before getting into the channel selection framework
BMS is fundamentally required to save on electricity costs and improve Indoor air quality and Building automation needs. It is a must-purchase for Mid to big-size commercial buildings.
Average Deal Value for an Office Building
The average cost of BMS for an office building of 65,000 sq. ft is USD 62,500 (INR 90 per sq. ft)
Average Deal Value for a Hotel
The average cost of BMS for an office building of 80,000 sq. ft is USD 62,193 (INR 65 per sq. ft)
The lifetime value of retained customers (95% retention) is 3X of the Avg. Deal Value (Function of the subscription cost, retention rate (90%), Annual Maintenance contract, and Multisite implementation)
For an Office Building, it is USD 187,500
3 stages to get the Customer Acquisition Cost
1. Cost per lead, In this case, CPMQL
2. Cost per Deal, In this case, CPSAL
2 Customer Acquisition Cost (CAC)
The customer Acquisition Cost of an office building project is around USD 678.
The lifetime value of the same customer is USD 187,500
LTV/CAC: 276.56
To select an appropriate channel, we can check the CPMQL and CPSAL of the channel along with the Channel decision framework.
Channel | Flexibility | Effort | Speed | Scale | CAC |
Organic Search | High | High | Moderate | High | Low |
Content Loops | Moderate | Moderate | Low | Moderate | Moderate |
Account-based Marketing (ABM) | High | High | Low | High | Moderate |
Paid Ads | High | Low | High | High | Low |
Partner Program | Moderate | High | Moderate | High | High |
Channel 1: Organic SEO
Why am I selecting Organic SEO?
When it comes to SEO for lead generation, we can expect Quality leads from the website, as it is a similar case with every competitor in this (building automation, BMS) industry. We can use our website to deliver exceptional experiences and create brand differentiation with rich graphics, details of use cases, and integration opportunities.
Type of search | Keyword | Search volume (avg monthly) | Difficulty ranking on SEO | Avg cost per click | Time to get an outcome | Projected Click through rate | Website land to conversion rate | Potential Monthly leads |
Use case | How can scheduling HVAC Save time | 107 | 16%, Low | $0.23 | Low | 10% | 3-8% | 2 to 5 |
| Building automation | 3070 | 34%, Medium | $4.19 | Medium | 15% | 5-10% | 3 to 5 |
| Building management system | 300 | 25%, Low | $1.32 | Low | 15% | 8-12% | 2 to 5 |
Competitor | Schneider | 33000 | 93%, Extremely High | $6.23 | High | 10-15% | 2-6% | 1 to 3 |
| Schneider BMS | 140 | 75%, High | $3.64 | high | 10-15% | 3-8% | 2 to 4 |
| Schneider Electric | 74000 | 86%, Extremely High | $7.24 | high | 5-10% | 2-6% | - |
Your product | 75F Thermostat | 220 | 15%, Low | $0.26 | Low | 20-25% | 8-15% | 3 to 8 |
| Central control unit | 650 | 27%, Medium | $0.35 | Low | 25-30% | 8-15% | 3 to 7 |
Your brand name | 75F | 4280 | 10%, Low | $0.15 | Low | 35% | 10-15% | 5 to 8 |
| 75F Smart innovations | 300 | 12%, Low | $0.14 | Low | 35% | 8-15% | 5 to 8 |
| 75F Bangalore | 200 | 9%, Low | $0.36 | Low | 30% | 8-15% | 5 to 8 |
Here is a competitor analysis on keywords, Website Traffic, and Authority score. ,
,
For reference, here is a screenshot of 75F website traffic in the last 12 months:
80% of the searches are around 75F brand or product-related keywords and for informational purposes. on average we get 24-30 decent quality leads from our website per year (less than 10% of the total)
However, in the longer term, we can build on our brand name and rank for a certain keyword.
{GAP Analysis}
Based on the Keyword analysis we need to focus on brand-specific and product-specific keywords for the first 3-5 months. We can create 3 pillar pages in the Blog/news section and 3-4 subpages each, I have listed down the topic for each page.
We can create 5 pillar pages in the Blog/news section and 3-4 subpages each, I have listed down the topic for each page
Pillar pages:
[Use case] Retrofit Friendly IoT BMS
[Use case] Indoor Air Quality Management
[Use case] Automated Demand Response
[Product] HyperStat - sensor & Controller
[Use case] 75F - Rise of a challenger brand
Subpages:
Headline: Effortless & Efficient time-saving benefits of 75F IoT BMS.
Headline: what makes HyperStat -an award-winning controller a must for your facility?
Headline: It is time to switch from your legacy yet rigid BMS to an advanced IoT based Building intelligence
Distribution channels
Primary: Blogs & Whitepapers
Secondary/ Repurpose content: LinkedIn, Twitter, Monthly Newspaper.
Channel 2: Paid Ads (LinkedIn ad)
Why am I selecting Paid ads?
As mentioned in the channel decision framework Paid campaigns have shown great results when it comes to quality of Deals.
Cost per MQL from Paid ad: USD 31
Cost per SAL from Paid Ad: USD 62
If we compare it against any other channel then this is the lowers value.
LTV/CAC for paid ads is USD 139
It is flexible and scalable based on the market trends and requirements from regional sales teams. It is also the fastest channel to execute!
Here is an Example:
Day 1: Sales head – We need more deals in Q2 from the West region as it is lagging in deal creation and deal value target.
Day 2: The Marketing team can start working on the industry specific campaign for West region. That includes creatives, AD copies, budget allocation, and expected results.
Day 6: Present the plan to the sales head if it matches the expectations then it can be activated on the very next day.
Day 7: The LinkedIn ad campaign is LIVE adaptable
Let’s select an ICP that is most lucrative and adaptable to ads
Why ICP 1:
Apart from what we mentioned in ICP segmentation, this ICP has
- The Highest TAM
- The most number of use cases they can explore with 75F BMS
- High ticket customers (USD 62,500)
- Active on LinkedIn as their primary channel to consume information
What’s More?
This ICP consists of a majority of Facility management professionals who have done their engineering and then taken charge of energy manager or building operations roles. They prefer LinkedIn as a key medium for 3 things - To stay connected with the FM world, Boost their career achievements, find interesting articles, and industry updates on building automation or sustainability domains and search for new jobs. As per the primary research, LinkedIn is the only Digital platform that provides them all 4 benefits hence they often (8-12 times a week) check their LinkedIn feed.
Why LinkedIn?
LinkedIn is ideal for segmentation and targeting:
Understanding the importance of user segmentation based on Geography, Company size, Designation, and Experience it becomes much easier to create personalized messaging /ad copies. Whether it’s an awareness campaign, lead generation campaign or retargeting of website visitors or previous LinkedIn campaign visitors, LinkedIn provides a single platform to do all the possible experimentation with user profiles throughout the marketing funnel.
Execution:
How to choose the right segment (set of audience)?
Location: PAN India
Industry Verticals (We will be targeting the office buildings of these industries):
Business Consulting and Services, Banking, Investment Banking, Technology, Information and Internet, IT Services and IT Consulting, Staffing and Recruiting, Facilities Services, Office Administration, Telephone Call Centers, Health and Human Services, Computers and Electronics Manufacturing, Business Intelligence Platforms, Business Content, Media and Telecommunications, Environmental Quality Programs.
Company Size:
501-1000 employees, 1001-5000 employees, 5001-10,000 employees, 10,001+ employees
Ad Caption: Learn how India's largest e-commerce retailer saved 20% of energy in its Office Building and reduced its expenditure on HVAC and BMS. Download the case study to learn the secret of India's largest e-commerce retailer energy savings, reduced bills, and increased occupant comfort using 75F’s HVAC solutions across 8,37,279 square feet of its office space.
Headline: 20% savings on HVAC and Energy bills for India's largest E-commerce Retailer's Office Building | Download Case Study
Creative:
Existing results:

{GAP Analysis}
Along with targeting industries, we should insert list of companies that we want to focus on in a stage-wise manner. That will narrow down the focus and produce quality leads (lead volume might get hampered but the quality will increase as they are close to the ICP description)
Depending on the size of the companies we should select the Case study or whitepaper as our audience might relate better to similar size of company.
Revised creative:

Projected campaign stats:
With this tweak, we can expect quality leads at lower CPL
Channel 3: Paid + Organic (Account Based marketing)
ABM can help us communicate the right message to high-value accounts by hyper-personalizing the buyer’s journey and tailoring all communications, content, and campaigns to those specific accounts.
Inbound marketing lays the foundation for a strong ABM strategy — ABM builds off on inbound by allowing for targeted and efficient resource allocation of high-value accounts. ABM can go in synch with the sales team’s efforts.
Here we have described 3 three-stage approaches to run successful ABM campaigns.
Stage 1: Select Key Accounts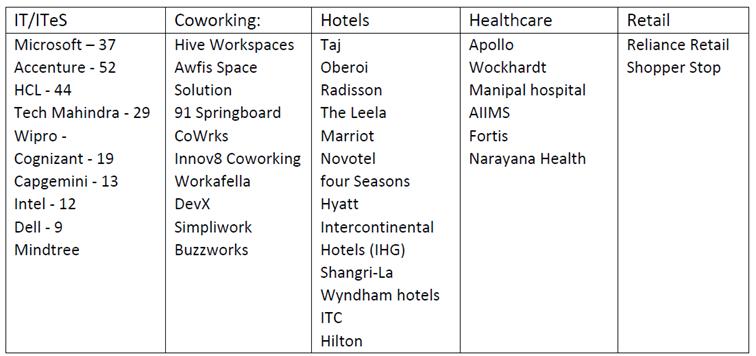
ICP 1 is listed in the First Column, which includes Company names and contact persons we have in a database.
Criteria to shortlist accounts:
- Multisite operations
- Engagement with a sales team
- Financial capacity to invest
Stage 2: Set up Campaign Framework
Success metrics:
- No. of deals generated from the campaigns, conversion rate (Demo, Survey) 45-65 MQLs > 30-40 SALs
- Engagement with content & website (open & click rate)
- Pipeline velocity (quick movement on Pipedrive)
- ROI (against other marketing sources, One vertical vs Other)
Duration: 45 Days for each vertical
Budget: (Creative - 10k, Content - 10K, Li Ads -45K, Google Ads - 25K) = 90K INR
Channels:
- Email Campaigns
- LinkedIn sales navigator & Ads (Awareness & lead gen)
- Google Ads
- Account-wide event (similar to treat & train)
Support needed:
- Account-specific research - sustainability targets, facility-specific challenges, pain point & gain creator, Persona.
- Landing page - redirect existing industry pages or create new ones
- Case studies
- Creatives and Ad copies
- Estimated time to prepare this content: 5 days per vertical. (Included in entire duration)
Designations:
As per the ICP 1
Stage 3: Execute the Campaign

LinkedIn and Google Ads will be sub-parts of this campaign.
Email Campaign:
Anchor emails - 2
Consideration emails - 2
Evaluation emails - 2,
Demo - 1
With the listed target audience, budget, strategy, and support from the sales team we can execute this channel and expect 35-45 SALs in 1.5 to 2 months of the timeline.
Brand focused courses
Great brands aren't built on clicks. They're built on trust. Craft narratives that resonate, campaigns that stand out, and brands that last.


All courses
Master every lever of growth — from acquisition to retention, data to events. Pick a course, go deep, and apply it to your business right away.


Explore courses by GrowthX
Built by Leaders From Amazon, CRED, Zepto, Hindustan Unilever, Flipkart, paytm & more
Course
Advanced Growth Strategy
Core principles to distribution, user onboarding, retention & monetisation.
58 modules
21 hours
Course
Go to Market
Learn to implement lean, balanced & all out GTM strategies while getting stakeholder buy-in.
17 modules
1 hour
Course
Brand Led Growth
Design your brand wedge & implement it across every customer touchpoint.
15 modules
2 hours
Course
Event Led Growth
Design an end to end strategy to create events that drive revenue growth.
48 modules
1 hour
Course
Growth Model Design
Learn how to break down your North Star metric into actionable input levers and prioritise them.
9 modules
1 hour
Course
Building Growth Teams
Learn how to design your team blueprint, attract, hire & retain great talent
24 modules
1 hour
Course
Data Led Growth
Learn the science of RCA & experimentation design to drive real revenue impact.
12 modules
2 hours
Course
Email marketing
Learn how to set up email as a channel and build the 0 → 1 strategy for email marketing
12 modules
1 hour
Course
Partnership Led Growth
Design product integrations & channel partnerships to drive revenue impact.
27 modules
1 hour
Course
Tech for Growth
Learn to ship better products with engineering & take informed trade-offs.
14 modules
2 hours
Crack a new job or a promotion with ELEVATE
Designed for mid-senior & leadership roles across growth, product, marketing, strategy & business


Learning Resources
Browse 500+ case studies, articles & resources the learning resources that you won't find on the internet.

Patience—you’re about to be impressed.